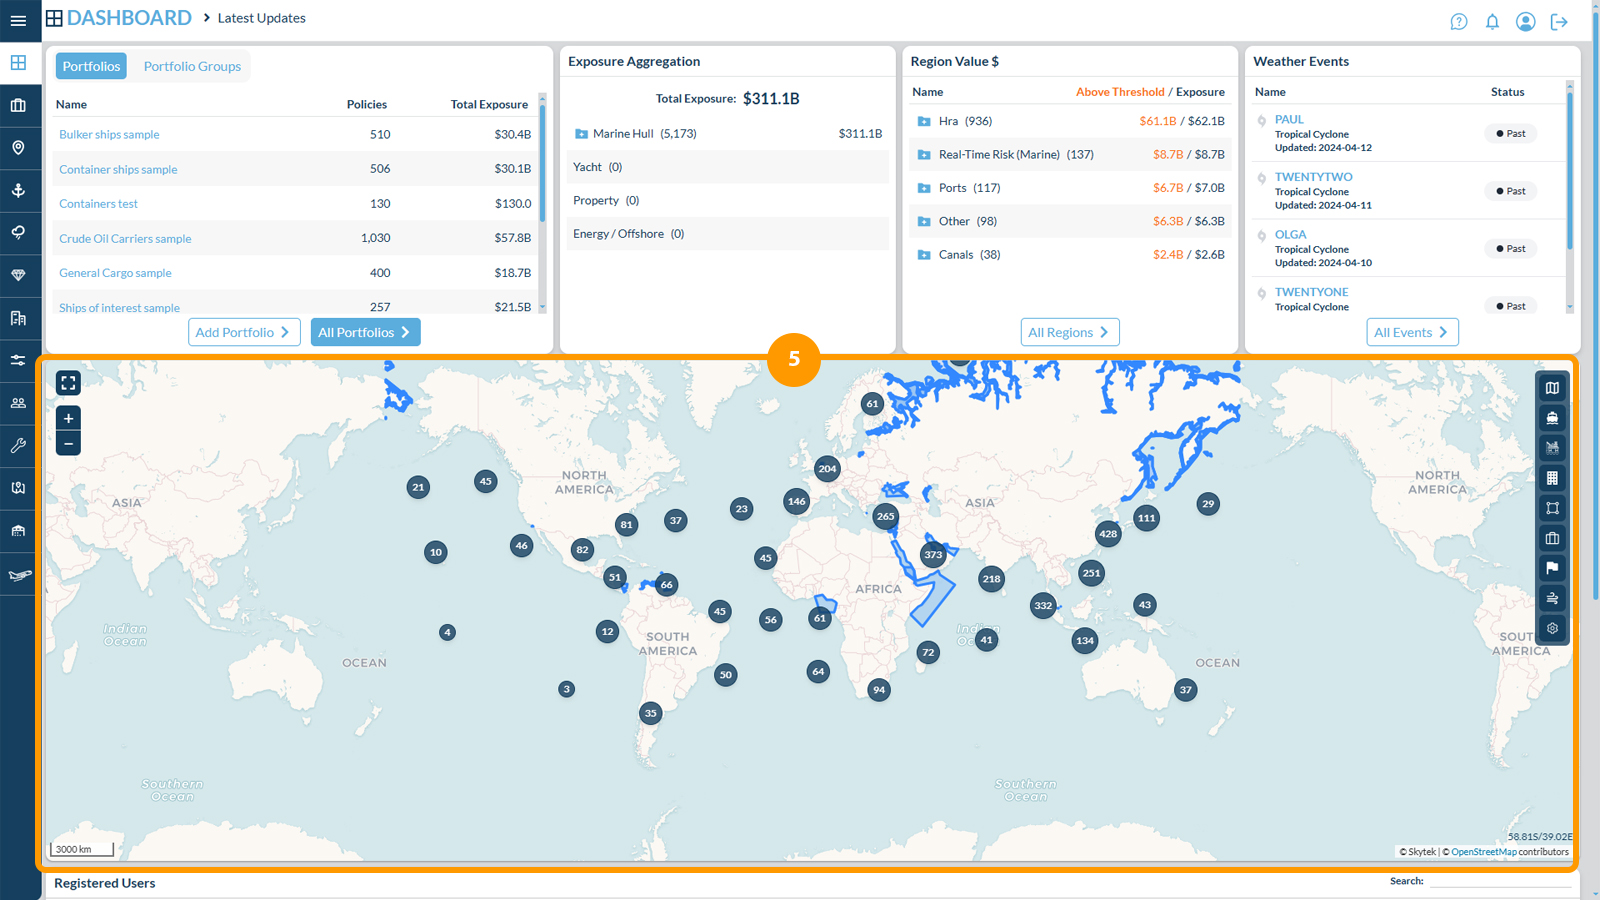
The Dashboard includes five main panels:
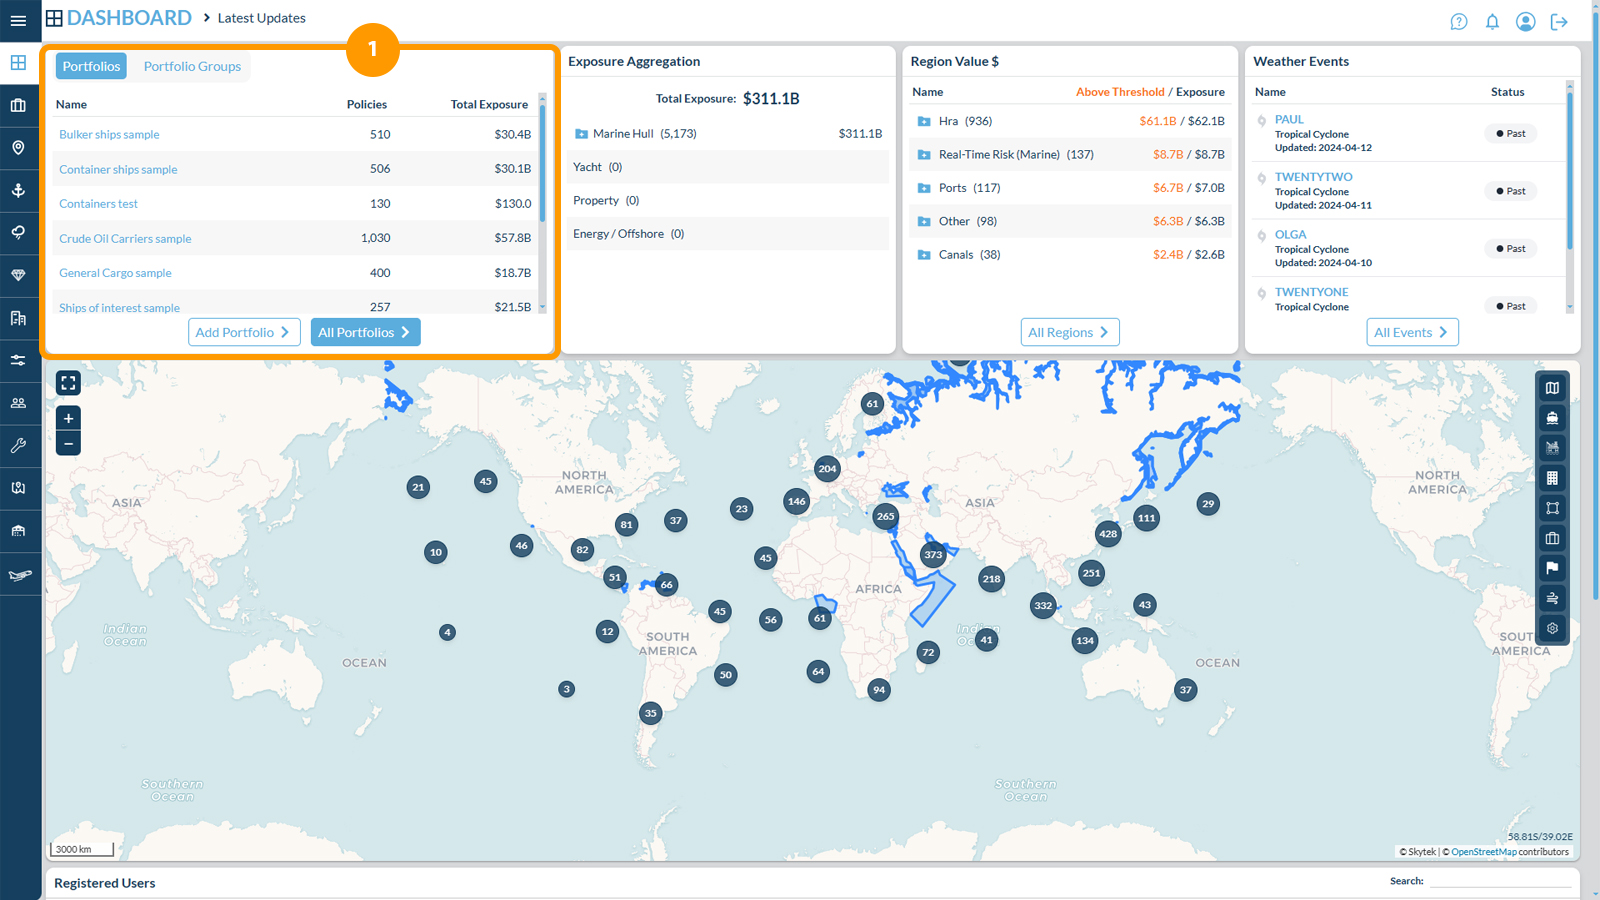
1. Portfolio Panel
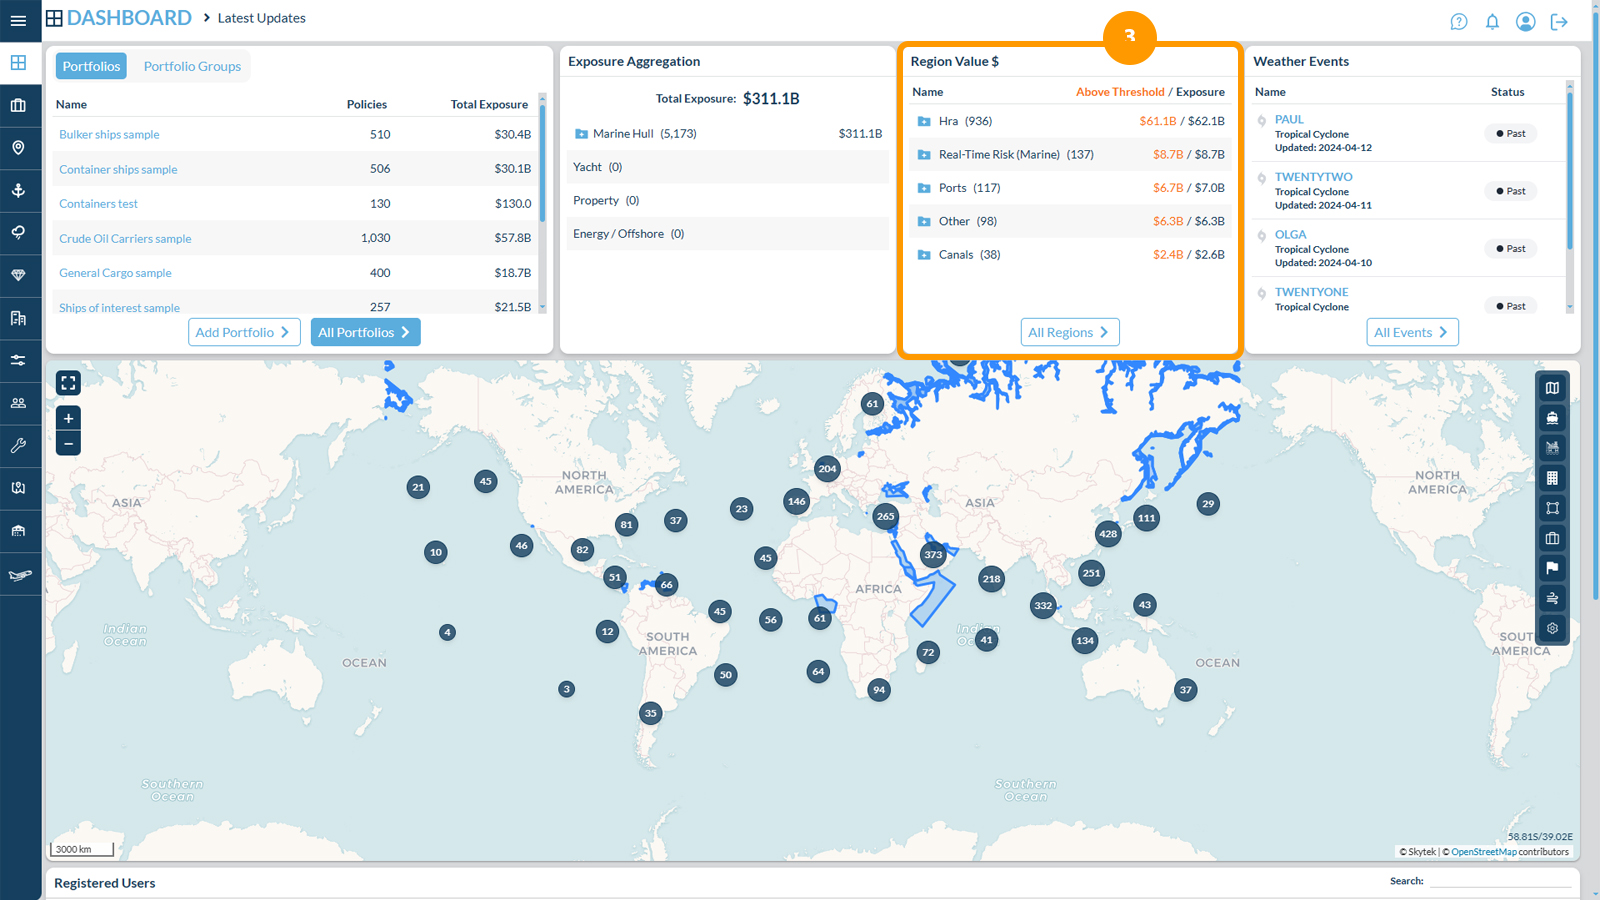
3. Regions Panel
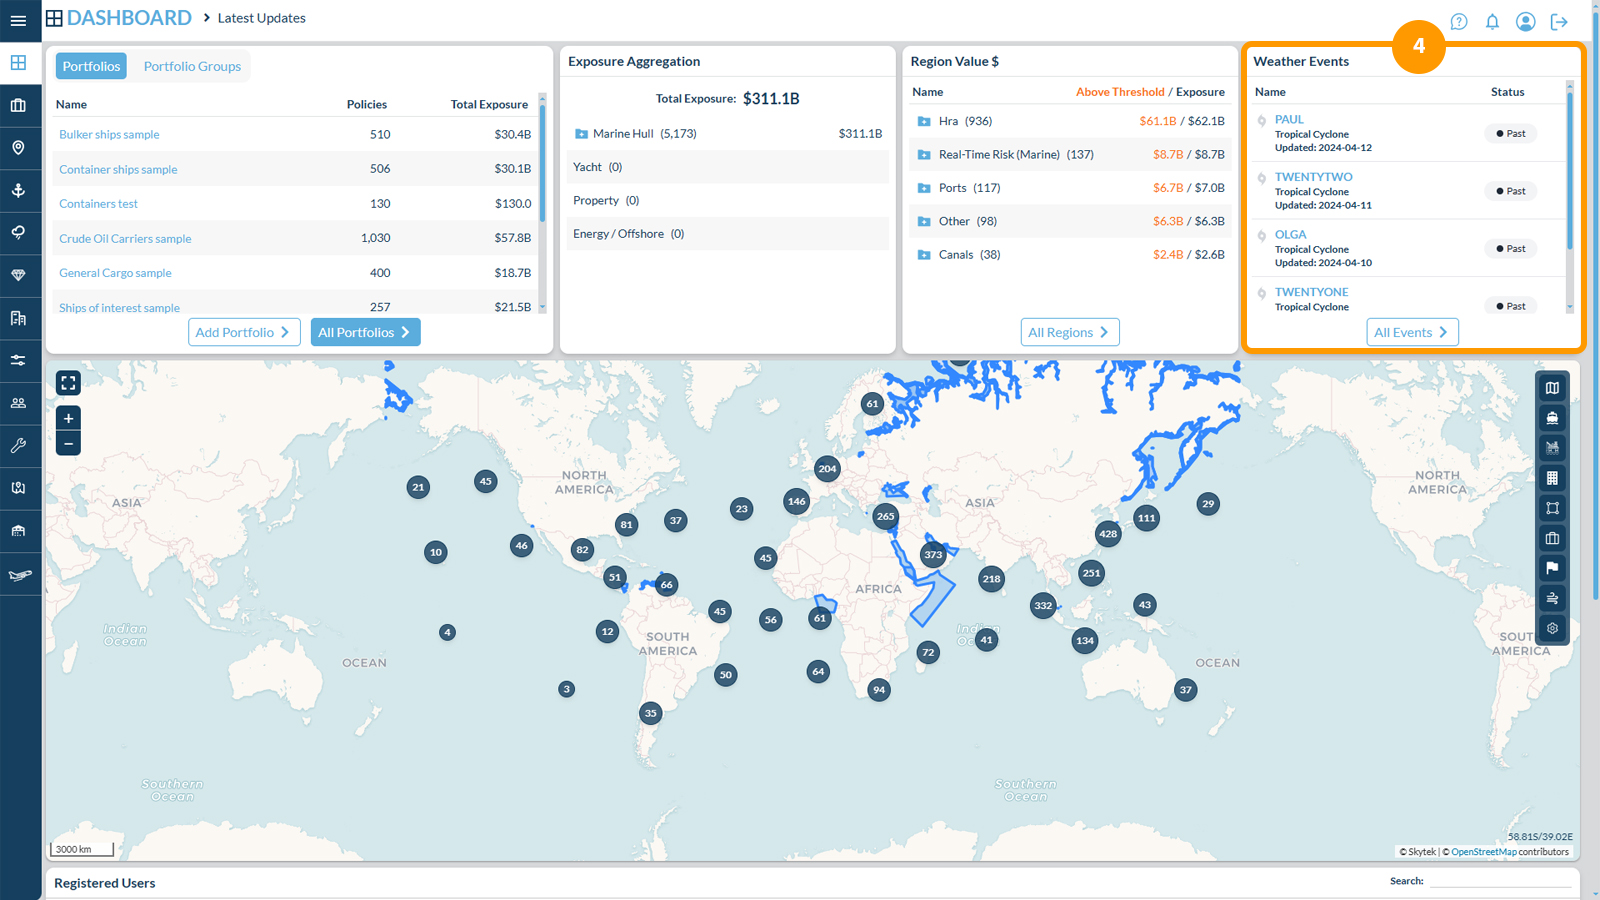
4. Weather Events Panel
5. Map Panel